Sie sind hier
WaferMap
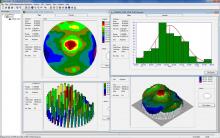
WAFERMAP is an award winning software package used to collect, edit, analyze and visualize measured physical parameters on semiconductor wafers. WAFERMAP can import data files from various metrology tools such as ellipsometers, thickness gauges and four point probes. The imported data can then be visualized or printed as line scans, contour plots, 2D or 3D plots or as a histogram.
Several kinds of operations can be applied to the wafer maps such as rotation, shifting of the grid in the X or Y direction, or mirroring the data along the X or Y axis. Global operations such as adding or subtracting a constant or taking the 1st or 2nd derivative can be carried out.
A Sigma Filter allows for the elimination of sites that exceed a user-defined range (e.g. measurement errors). It is also possible to compare different sets of data by adding, subtracting or dividing entire wafer maps. Typical applications include map generation for manually operated metrology tools and standardized visualization for different automatic metrology equipment (e.g. different types of four point probes in the same fab). WAFERMAP allows users to work off-line and to analyze and edit metrology data outside of the clean room. It's the perfect solution for paperless fabs.
Please contact us for more details.

